
How to Turn Goalie Rebounds Into Consistent, Reviewable Data
Classify freezes, controlled and dangerous rebounds, log follow-up attempts, and report each rate with its denominator and event window.
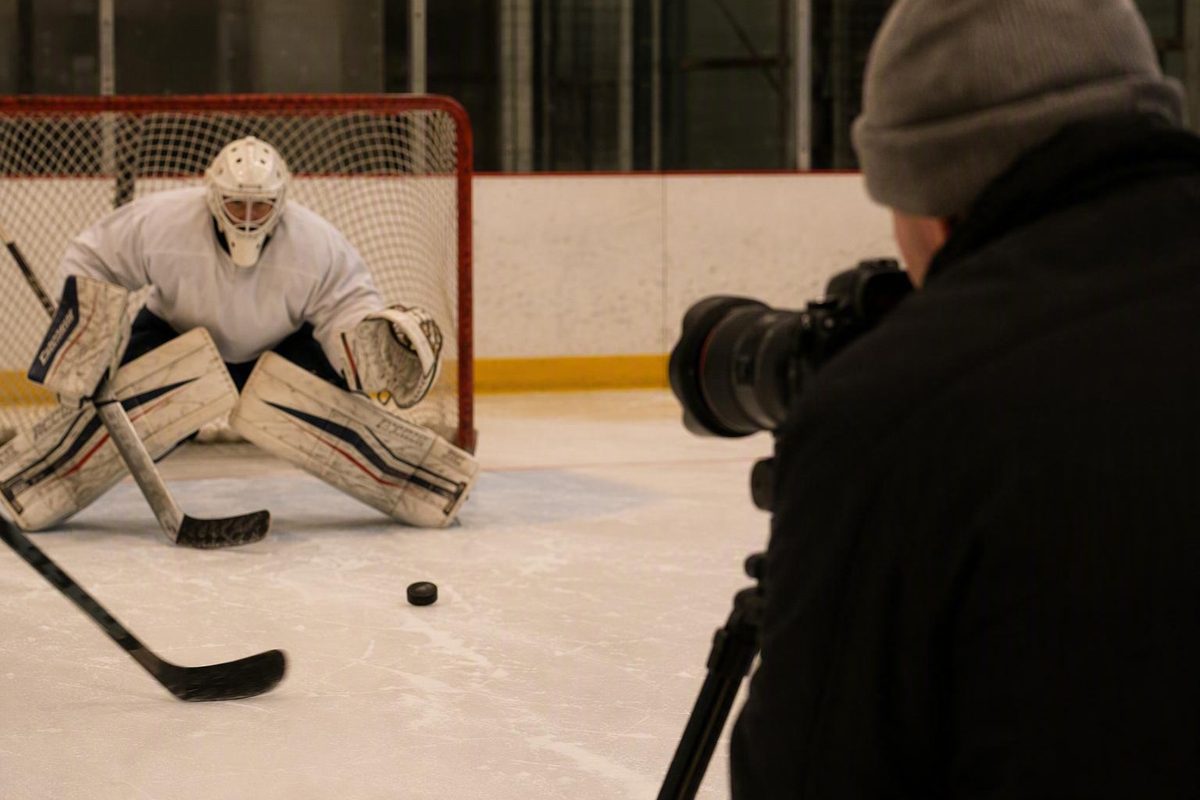
The most defensible way to track hockey goalie rebound control is to preserve the underlying outcomes instead of forcing them into one score. Define eligible shots, tag the initial result, classify each live rebound, record every qualifying follow-up, and review uncertain clips. Report freezes or possession, controlled rebounds, dangerous rebounds, saves producing follow-up attempts, total rebound attempts, rebound shots, rebound saves, and rebound goals separately—with the denominator and event window stated for every rate.
The short answer: track outcomes, not one catch-all score
“Tracking” has two meanings here. Statistical rebound tracking is the reviewer’s process of recording what happens after shots and saves. Video analysis can connect the two, but they are not the same task.
Use this five-step workflow:
- Define eligible shots. Decide whether the review includes all shots on goal, saved shots, non-frozen saves, rebound shots faced, or another stated population.
- Tag the initial result. Use
GoalorSave; do not mix rebound disposition into this field. - Classify the save. Record whether the goalie secured possession. If the puck remained live, apply a written zone definition and label the rebound controlled or dangerous.
- Record the follow-up sequence. Note whether at least one qualifying attempt occurred, the time to each attempt, and every result within the declared window.
- Review uncertain clips. Rewatch disputed events and preserve uncertainty rather than forcing a definitive label.
Existing systems do not use one common vocabulary. The manually maintained Yegorov dashboard describes controlled, dangerous, and freeze/no-rebound categories. The Goalie Rebound Tracking app lists Possession, Corner, Square, Weakside, and Goal.
A transparent local rubric is therefore more useful than language implying universal acceptance. A community discussion about manually collected goalie data similarly proposed separating freezes, controlled rebounds, and dangerous rebounds while warning that ambiguous clips and inconsistent entry can undermine comparisons. That is useful methodological input, not evidence that the categories have been validated or predict wins (read the discussion and proposed distinctions).
A basic decision table can keep the first pass consistent:
| Observed result | Suggested label | Denominator treatment |
|---|---|---|
| Initial shot enters the net | Initial-shot goal | Excluded from saved-shot rebound metrics |
| Goalie secures a saved shot under the declared rule | Freeze or possession | Included in all saved shots; excluded from live rebounds |
| Saved shot remains live in a defined low-danger area | Controlled live rebound | Included in saved shots and live rebounds |
| Saved shot remains live in a defined high-danger area | Dangerous live rebound | Included in saved shots and live rebounds |
| Follow-up rebound shot enters the net | Rebound goal | Included as a rebound shot faced and rebound goal |
The table does not produce a verdict by itself. It preserves what happened so that different questions can be answered without recoding the underlying event.
Use this rebound-control tagging rubric
The following is Hockey Ice Skill’s suggested editorial framework for repeatable video review. It is not an official or validated rebound-control instrument.
Freeze or possession: A saved shot secured by the goalie, or a saved shot followed by a stoppage under the review’s declared rule. Decide in advance whether no-rebound saves and formal freezes are combined. If the distinction matters, record them separately and combine them only for a clearly named summary measure.
Use Freeze or Possession = Yes, No, or Disputed. This keeps it separate from Initial Result, which should contain only Goal or Save.
Controlled live rebound: A saved puck left in play but directed into a predefined low-danger area, such as a corner or an area outside the immediate scoring lane. “Controlled” describes the observed result under the rubric; it does not prove that the goalie intended the placement.
Dangerous rebound: A saved puck left in a predefined high-danger area where an opponent could create an immediate follow-up opportunity. Establish the boundaries before reviewing the game. A rink diagram is preferable, although a precise written zone map can also support consistent tagging.
Terms such as corner, square, and weakside are not self-defining. Mark their boundaries on the diagram, explain how boundary pucks are handled, and use the same orientation at both ends of the rink. No particular boundary should be presented as universally correct without validation.
Initial-shot goal: The original shot enters the net. Because there was no save, it did not produce a saved-shot rebound.
Rebound goal: A saved puck remains live, a subsequent rebound shot follows within the declared event rule, and that shot enters the net.
Rebound location and follow-up outcome belong in separate fields. A dangerous rebound may be cleared before an opponent can shoot. Conversely, a puck initially classified in a low-danger area may still generate an attempt because of pressure, a turnover, or an unusual bounce.
When the footage permits, add an Apparent Intent field with three allowed values:
- Controlled
- Accidental
- Indeterminable
Use technique and sequence evidence—not final location alone. A puck reaching the corner after striking a pad, defender, or stick may have a desirable result without demonstrating intentional direction.
Copyable video-review worksheet and tagging workflow
Define the eligible event population before opening the footage. Common choices answer different questions:
- All shots on goal: reviews initial goals and saves together.
- All saved shots: supports freeze percentage and dangerous rebounds per save.
- Non-frozen saves: isolates what happens when the puck remains live.
- Rebound shots faced: supports rebound save percentage.
Do not move between these populations without changing the metric label. A percentage calculated from all saves is not interchangeable with one calculated from live rebounds.
Record this metadata once for every dataset:
Reviewer Name:
Review Date:
Codebook Version:
Eligibility Rule:
Follow-up Event Window:
Game or Sample:
Use one row per initial shot or save in the main sheet. A unique Event ID links that row to any later follow-up records:
Event ID; Game; Period; Clock; Goalie; Game State; Initial Shot Location; Shot Type; Traffic; Initial Result; Freeze or Possession; Rebound Direction; Rebound Zone; Controlled or Dangerous; Follow-up Attempt; Seconds to Follow-up; Defender Intervention; Rebound Shot Result; Reviewer Confidence; Clip Reference; Notes
Use these permitted values for overlapping fields:
Initial Result: Goal or SaveFreeze or Possession: Yes, No, or DisputedControlled or Dangerous: Controlled, Dangerous, or Not ApplicableFollow-up Attempt: Yes, No, or UncertainReviewer Confidence: High, Medium, or Uncertain
In the main sheet, Follow-up Attempt = Yes means that the initial save produced at least one qualifying opposing attempt within the declared window. Seconds to Follow-up and Rebound Shot Result can summarize the first qualifying attempt, but that is not enough when a sequence contains multiple attempts.
For projects that preserve every follow-up, use a linked table:
Event ID; Follow-up Number; Seconds After Initial Save; Attempt Type; Shot on Goal; Result; Defender Intervention; Reviewer Confidence; Notes
This structure separates two useful quantities:
- The number of non-frozen saves that produced at least one follow-up attempt
- The total number of follow-up attempts produced by those saves
Without a linked table, a sequence containing two or more attempts would be reduced to a single binary result and the extra attempts would be lost.
Review each eligible event in sequence:
- Enter the event ID, game context, shot location, shot type, traffic, and clip reference.
- Code
Initial ResultasGoalorSave. - For a save, record
Freeze or PossessionasYes,No, orDisputed. - If the puck remained live, record its direction and zone before assigning controlled or dangerous.
- Record whether the save produced at least one qualifying follow-up within the declared window.
- Add every qualifying follow-up to the linked table, including its timing and result.
- Mark defender intervention, reviewer confidence, and anything needed to reconstruct the decision.
Watch each play at normal speed first. That preserves pressure, timing, traffic, and defensive context. Use slow motion afterward to resolve puck location, contact, possession, or the order of events.
A simple confidence scale is sufficient:
- High: The puck, goalie action, and result are clearly visible.
- Medium: The likely result is visible, but one detail is partially obstructed.
- Uncertain: Location, possession, contact, or sequence cannot be resolved reliably.
Exclude uncertain events from the primary calculation or report them as a separate group. Do not convert uncertainty into false precision.
Apply explicit edge-case rules:
- Mark blocked views as uncertain.
- Record screens, tips, and deflections in the traffic or notes fields.
- Do not infer possession merely because a whistle eventually follows.
- Note disputed control when the goalie briefly traps and then loses the puck.
- Tag defender clearances separately from goalie-directed outcomes.
- Keep loose pucks without a clear location view out of definitive zone comparisons.
- Preserve the observed event record if a later review changes only its confidence label.
The reviewer name, review date, codebook version, event window, and eligibility rule make it possible to determine whether separate games were tagged under the same method.
Calculate four transparent rebound metrics
Once the worksheet is complete, calculate component rates rather than one undocumented efficiency score.
1. Freeze percentage
Freeze percentage = frozen or possessed saved shots ÷ all eligible saved shots
This describes how often an eligible save ends in a freeze or possession under the stated rule. If formal freezes and other secured possessions are coded separately, identify which values are included in the numerator.
2. Dangerous-rebound rate
Force the denominator into the metric’s label:
Dangerous rebounds per all eligible saves = dangerous live rebounds ÷ all eligible saves
Dangerous rebounds per live rebound = dangerous live rebounds ÷ all live rebounds
The first measure retains freezes in the denominator. The second asks only how live rebounds were distributed. They can produce different impressions of the same set of saves.
3. Saves producing a follow-up attempt
Use a binary save-level measure as the primary follow-up rate:
Saves producing a follow-up attempt = non-frozen saves with at least one qualifying follow-up attempt ÷ all non-frozen saves
Count each initial save no more than once in the numerator, even if the sequence produces multiple attempts. This keeps the result interpretable as the percentage of live-save sequences that became an immediate opposing attempt.
If attempt volume also matters, report it separately:
Follow-up attempts per non-frozen save = total qualifying follow-up attempts ÷ all non-frozen saves
This second measure can exceed 100% when some initial saves lead to multiple attempts. It should therefore be described as an attempt rate, not as the percentage of saves producing an attempt.
4. Rebound save percentage
Rebound save percentage = rebound shots saved ÷ rebound shots faced
It can reflect recovery, positioning, rebound danger, shooter quality, and defensive context—not only the quality of the initial rebound.
Hypothetical worked example
Suppose 20 initial saves produce:
- 6 freezes
- 10 controlled live rebounds
- 4 dangerous live rebounds
- 3 of the 14 non-frozen saves produce at least one follow-up attempt
- Each of those three sequences produces one rebound shot
- The goalie saves 2 of the 3 rebound shots
The calculations are:
- Freeze percentage: 6 ÷ 20 = 30%
- Dangerous rebounds per all saves: 4 ÷ 20 = 20%
- Dangerous rebounds per live rebound: 4 ÷ 14 = 28.6%
- Saves producing a follow-up attempt: 3 ÷ 14 = 21.4%
- Follow-up attempts per non-frozen save: 3 ÷ 14 = 0.214, or 21.4 per 100 non-frozen saves
- Rebound save percentage: 2 ÷ 3 = 66.7%
The save-level follow-up percentage and attempt-volume rate happen to have the same numeric value because each qualifying save produced exactly one attempt. If one of those saves had produced two attempts, the save-level numerator would remain three while the attempt-volume numerator would rise to four.
Each result answers a different question. Publishing named numerators, denominators, event counts, and timing rules makes the review reproducible without collapsing the components into one verdict.
How the historical two-second method works
A 2015 third-party analysis used five-on-five play-by-play data for goalies who faced at least 500 five-on-five shots. It separated rebound control into Frozen Shot Percentage, Adjusted Rebound Percentage, and Rebound Save Percentage rather than claiming that one statistic captured the entire skill. Frozen Shot Percentage counted saved shots followed by a stoppage within two seconds. Adjusted Rebound Percentage divided rebound shot attempts occurring within two seconds by saves minus frozen pucks (see the historical methodology).
Adjusted Rebound Percentage = two-second rebound shot attempts ÷ (saves − frozen pucks)
Frozen saves were removed because the measure asked how often a non-frozen save became an immediate rebound attempt. Unlike the binary save-level metric above, its numerator counted rebound shot attempts. A sequence with multiple qualifying attempts could therefore contribute more than one event if represented that way in the underlying play-by-play data.
Rebound Save Percentage measured save percentage on rebound shots. It complemented the first two measures by describing the result after the follow-up reached the net, although it also incorporated recovery, positioning, rebound danger, and defensive context.
The analysis reported year-to-year correlations of 0.58 for Frozen Shot Percentage, 0.26 for Adjusted Rebound Percentage, and 0.24 for Rebound Save Percentage. It also reported 2009–2015 reference values of 29% for Frozen Shot Percentage and 5.7% for Adjusted Rebound Percentage (see the reported historical findings).
The analysis also did not report uncertainty estimates establishing how precisely the correlations represented persistent goalie ability.
The two-second window was an analyst-designed convention, not an official or uniquely correct rebound definition. A video reviewer may use one, two, three, or another number of seconds, but the choice must be declared. Testing multiple windows can show whether a result is stable or depends heavily on the cutoff.
Quality control before comparing games or goalies
Start with a written codebook containing:
- Zone definitions and a rink diagram
- Eligible-shot rules
- Allowed values for every field
- Freeze and possession definitions
- Controlled and dangerous rebound criteria
- The follow-up event window
- Rules for counting multiple follow-up attempts
- Denominators for every rate
- Treatment of whistles, deflections, traffic, and defender clearances
- Confidence rules
- Example clips for each category
After completing a game or group of games, re-tag a sample without looking at the original entries. Compare the two sets of labels to expose drift in one reviewer’s decisions.
Where possible, ask a second reviewer to tag the same sample independently. Discuss disagreements only after both reviews are complete, revise unclear rules, and repeat the check. The purpose is not to assume every judgment must be identical; it is to identify definitions that reviewers cannot apply consistently.
Always publish event counts beside the rates. “Four dangerous rebounds among 14 live rebounds” is more informative than “28.6% dangerous” alone. No validated minimum sample size is supplied here, so avoid rankings or broad conclusions from a handful of events.
Separate contexts when the sample permits:
- Even strength versus special teams
- Rush versus cycle
- Screened versus clear-sight shots
- Different shot types
- Defender intervention versus no intervention
- Different game or score states
These are descriptive splits, not validated adjustment factors. They can identify clips worth reviewing without pretending to isolate the goalie completely.
Follow-up attempts depend partly on opponents and defenders. A defender can clear a dangerous puck, tie up a shooter, block an attempt, or fail to prevent a nominally safe rebound from becoming another chance.
Manually entered dashboard data are therefore not automatically comparable across goalies. Comparison requires the same event population, zone map, timing window, codebook, confidence policy, treatment of multiple attempts, and quality-control process.
Rebound-control outcomes must also remain distinct from save percentage, expected save percentage, xGA minus goals allowed, and other goals-saved measures. Those metrics answer related but different questions. Rebound tracking describes what happens after particular shots and saves; it does not independently measure total goalie quality.
Tools and practice: use tracked patterns without overstating them
The Goalie Rebound Tracking app’s listing says it records Possession, Corner, Square, Weakside, and Goal outcomes. It also describes support for multiple goalies and games or seasons, charts for several trends, and PDF or CSV exports. The listing promotes a Rebound Control Efficiency metric but does not disclose its formula, weighting, or validation method.
Buying decisions require additional caution. The displayed App Store history dates version 1.7 to October 23, 2020; Apple says there are too few ratings for an overview; and the developer had not supplied Apple with privacy-practice or supported-accessibility details on the cited listing (review the App Store information). These facts do not prove that the app is unusable, but they prevent confident claims that it is currently maintained, privacy-suitable, accessible, or independently validated.
Whether the worksheet is maintained in an app or spreadsheet, use recurring patterns to select video—not to declare causation. If dangerous rebounds repeatedly appear in one zone, review those clips for release tracking, squareness, body control, recovery, traffic, and apparent direction. The data identify the pattern; the video supplies the context.
A drill can then reproduce part of the decision environment. The documented Goalie Rebound Game uses two angled nets with one goalie in each and a shooter between them who may shoot at either net. Each goalie starts with 10 points. A direct goal costs one point, a deflection by the opposing goalie into the net costs two points, and the first goalie to reach zero loses. Its coaching cues emphasize tracking the release, staying square and controlled, reacting quickly, and directing rebounds intentionally (see the drill setup and scoring rules).
Those cues are instructional guidance, not demonstrated effects. Neither the app nor the drill is supported here by an independent study showing that it improves rebound control or game results.
The operating rule is simple: define the categories before opening the video, preserve the component counts instead of hiding them in one score, disclose every denominator and timing rule, and treat the resulting rates as descriptive evidence that guides further video review—not as a standalone verdict on the goalie.