
A Block Can Help Without Making the Block Leader the Best Defender
A block can stop a threat, but raw totals may rank exposure as much as effectiveness; ice time, attempts faced and deployment change the reading.
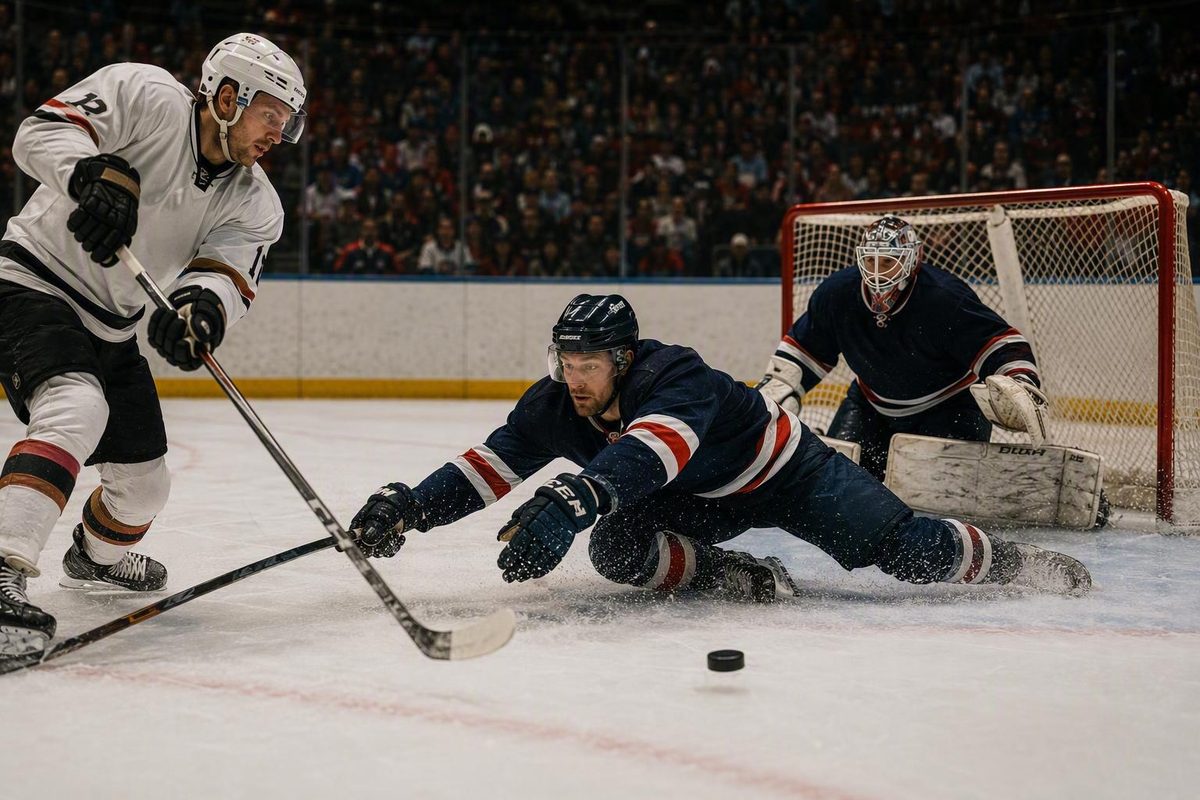
A blocked shot can stop a particular attempt or reduce danger on a specific play. But a high season total is not reliable evidence that a player is the best defender. Raw counts combine the player’s action with ice time, attempts faced, deployment, and game situation. Sound evaluation starts by adjusting for time and opportunity, then adds shot quality, possession outcomes, and the ability to prevent attempts before a block becomes necessary.
Related: Why NHL Wrist Shot and Snap Shot Goal Totals Are Hard to Compare.
The short answer: blocks can matter, but totals do not equal defensive value
The key distinction is between event-level value and metric-level usefulness.
At the event level, a skater who gets a stick or body in front of an attempt can interrupt a threat. At the season level, however, blocked-shot totals may rank exposure as much as defensive effectiveness. A player who repeatedly defends long shifts in the defensive zone has more opportunities to record blocks than one whose team prevents entries, wins possession early, or exits before opponents can shoot.
That means effective defense can produce a low block total. Denying entries, disrupting possession, closing lanes before shots develop, suppressing dangerous attempts, and recovering pucks do not necessarily create blocked-shot events.
The conclusion is not that blocks are worthless or that high totals cause losing. It is that the raw count cannot separate successful intervention from repeated exposure to pressure.
What officially counts as a blocked shot?
The NHL defines a blocked shot as an opponent’s shot attempt stopped by a skater using a stick or body. From the shooter’s perspective, the play counts as a shot attempt but not an unblocked shot attempt. The league abbreviates blocked shots as BkS and says the statistic has been recorded since the 2002–03 season. It also reports BkS/GP, or blocks per game, and BkS/60, or blocks per 60 minutes of ice time, in its official statistics glossary.
That definition explains how the event is recorded, not how much defensive value it created. The count alone does not distinguish a dangerous close-range opportunity from a distant attempt, nor does it show which team controlled the puck afterward.
Why blocked-shot leaderboards need an opportunity adjustment
Totals rise with both playing time and opportunities to defend. A player cannot block an attempt from the bench, while a player whose team rarely allows sustained offensive-zone possession may have relatively few chances to accumulate blocks.
Unequal opportunity can reflect:
- total ice time;
- attempts faced while on the ice;
- defensive-zone deployment;
- penalty-killing duties;
- score state;
- manpower state; and
- team tactics and possession patterns.
Defensive-zone start percentage provides deployment context, while isolating five-on-five play creates a more comparable manpower environment. Neither adjustment fully measures how many realistically blockable situations a player encountered.
Consider an illustrative calculation:
- Player A: 100 blocks while facing 1,000 attempts against
- Player B: 70 blocks while facing 500 attempts against
The raw leaderboard favors Player A, 100 to 70. Dividing blocks by attempts against produces 10% for A and 14% for B.
This does not prove that Player B is the better defender. Attempts against include plays the defender may not have been able—or tactically expected—to block, and the calculation ignores shot location, role, teammates, opponents, game state, and subsequent possession. It simply shows that the denominator changes the interpretation.
A community analysis of shot-blocking value raises the same opportunity question. Its rankings and estimated effects remain unverified without a reproducible model, but its underlying premise is valid: blocked-shot totals should not be interpreted separately from defensive exposure.
A practical table for choosing the right blocked-shot measure
| Measure | What it adjusts for | What it misses | Appropriate use |
|---|---|---|---|
| Total blocks | Nothing | Ice time, opportunity, deployment, shot danger | Describing recorded volume |
| Blocks per game | Games played | Minutes, opportunity, role, shot danger | Comparing similar per-game workloads |
| Blocks per 60 | Ice time | Attempts faced and blockable situations | Comparing frequency over equal minutes |
| Blocks per attempt against | Broad opportunity | Talent isolation, shot quality, rebounds, game state, post-block result | Comparing blocks relative to faced attempts |
Attempts against is a useful denominator, not a proven measure of true blocking opportunity. A defender may be on the ice for an attempt without having a realistic chance or tactical reason to block it.
Comparisons should therefore be role-matched. Five-on-five, penalty-kill, and goalie-pulled situations should be separated rather than blended, with defensive-zone starts and score state considered where possible. Blocks per 60 equalizes ice time; blocks per attempt against adds opportunity context. Neither is a complete defensive metric.
Why equal block counts need not have equal value
A defensible model would consider the threat posed by the underlying attempt instead of assigning identical value to every block.
Imagine one skater blocking a close-range attempt after dangerous pre-shot movement while another blocks an unscreened attempt from far away. Both receive one block, even though a shot-quality model may treat the underlying situations differently. This is a modeling principle, not proof of a specific value difference.
Relevant analytical dimensions could include:
- shot location and angle;
- shooter type;
- pre-shot movement or passing context;
- rebound treatment;
- which team recovers the puck; and
- whether the defending team exits the zone.
The post-block result matters to interpretation. Possession and a clean exit, a stoppage, a turnover, and an immediate repeat chance are different outcomes. The available evidence does not establish league-wide rates or quantified effects for those outcomes, so they should be measured rather than assumed.
Blocked shots belong alongside attempt suppression, dangerous-chance prevention, expected goals against, and possession recovery. The broader question is not merely how many attempts a player blocked, but how much offense developed during the player’s shifts and what happened after each intervention.
How to interpret expected goals prevented
Estimating “goals prevented” through shot blocking is a counterfactual task: the analyst must estimate what might have happened if an attempt had not been blocked.
The result is probabilistic. If a model assigns an unblocked version of an attempt a scoring probability, it is not saying that a goal certainly would have occurred. Adding those probabilities can produce an expected-goal estimate, but not an observed count of goals saved.
Shot-quality models may use location and event context, while rebound-specific treatment can change their expectations. MoneyPuck’s model methodology, for example, documents shot-quality inputs and rebound-related treatment. That documentation helps explain probabilistic modeling; it does not directly establish the defensive value of blocked shots.
Any estimate of blocking value should identify:
- the model and version;
- the attempts included;
- manpower and game states;
- the exposure measure and denominator;
- rebound treatment; and
- uncertainty around the result.
Outputs from different public models should not be combined or compared as though their definitions were identical. Differences in inputs, training data, rebound rules, and calibration can produce different estimates for similar plays.
What the older team-level evidence does—and does not—show
A 2012 CanucksArmy analysis covering three seasons reported little relationship between team blocked-shot measures and point percentage. It reported statistics of -0.144 for blocked-shot totals versus point percentage and -0.032 for even-strength blocked-shot percentage versus point percentage in its examination of whether blocked shots were associated with team success.
Those figures require substantial caution. The article described negative values as “r-squared,” even though r-squared is ordinarily nonnegative, so the statistic may have been mislabeled or incompletely explained. The analysis was informal, is now old, lacked complete methodology, uncertainty intervals, and significance tests, and did not adequately control for team strength, player role, game state, or shot quality.
A team-level correlation also cannot establish whether an individual block prevented danger or caused a team outcome. Teams that spend more time defending may record more blocks, reproducing the exposure problem found in player totals.
The analysis is best treated as a warning against simplistic leaderboard interpretation—not as proof that blocking is worthless.
A checklist for evaluating any shot-blocking value study
Before trusting an analysis, check whether it reports:
- Model identity: Name, version, definitions, and relevant changes.
- Sample period: Seasons, dates, leagues, and playing-time thresholds.
- Unit of analysis: Player, pairing, lineup, or team.
- Game situations: Five-on-five, penalty-kill, power-play, and empty-net treatment.
- Exposure measure: Games, minutes, shifts, defensive-zone time, or another basis.
- Opportunity denominator: Attempts against or another clearly defined measure.
- Deployment: Zone starts, score state, role, teammates, and opponents.
- Shot-quality inputs: Location, angle, pre-shot context, and other variables.
- Rebound treatment: How immediate follow-up opportunities are modeled.
- Post-block possession: Recovery, exit, stoppage, turnover, or repeat chance.
- Uncertainty: Intervals, sample-size sensitivity, and out-of-sample performance.
- Reproducibility: Enough data, definitions, formulas, or code to replicate the result.
The study should also distinguish among five types of claim:
- Observed count: How many blocks were recorded.
- Descriptive rate: Blocks per game, minute, or attempt faced.
- Correlation: Whether blocking and another outcome moved together.
- Counterfactual estimate: What a model predicts might have happened without the block.
- Causal claim: Whether blocking itself changed goals or wins.
Each step requires additional assumptions and evidence. A high rate does not automatically establish repeatable blocking talent, and a correlation does not establish causation.
For player evaluation, begin with attempt suppression—how much opposing offense develops while the player is on the ice. Then examine chance quality and expected goals against. Use blocked shots and post-block possession outcomes as additional context. This approach recognizes useful interventions without rewarding players merely for spending more time under pressure.
When did the NHL begin recording blocked shots?
The NHL says blocked shots have been recorded since the 2002–03 season and abbreviates the statistic as BkS in its statistics glossary.
Can blocked-shot statistics prove that a player prevented a goal?
No. A recorded block shows that a skater stopped an opponent’s attempt with a stick or body. It does not prove that the attempt otherwise would have reached the net or become a goal.
A model can estimate the probability of a goal in a counterfactual unblocked scenario, but that estimate remains dependent on its inputs, assumptions, and treatment of game state.
What is the best denominator for a shot-blocking rate?
No universally best denominator has been established. Attempts against adds more opportunity context than games or minutes, but it includes attempts the player may not have been able or expected to block.
Measures such as model-estimated blockable attempts or eligible shooting lanes are possible candidates for future validation, not proven ideal denominators. For now, use multiple layers: blocks per 60 for ice time, blocks per attempt against for broad opportunity, and role, game state, shot quality, and possession outcomes for interpretation. A leaderboard records events; it does not measure complete defensive impact.