
NHL Games Averaged 6.16 Goals in 2025–26
NHL games averaged 6.16 goals in 2025–26, or 3.08 per team. See recent seasons, the calculation and why shootout scorelines give a different total.
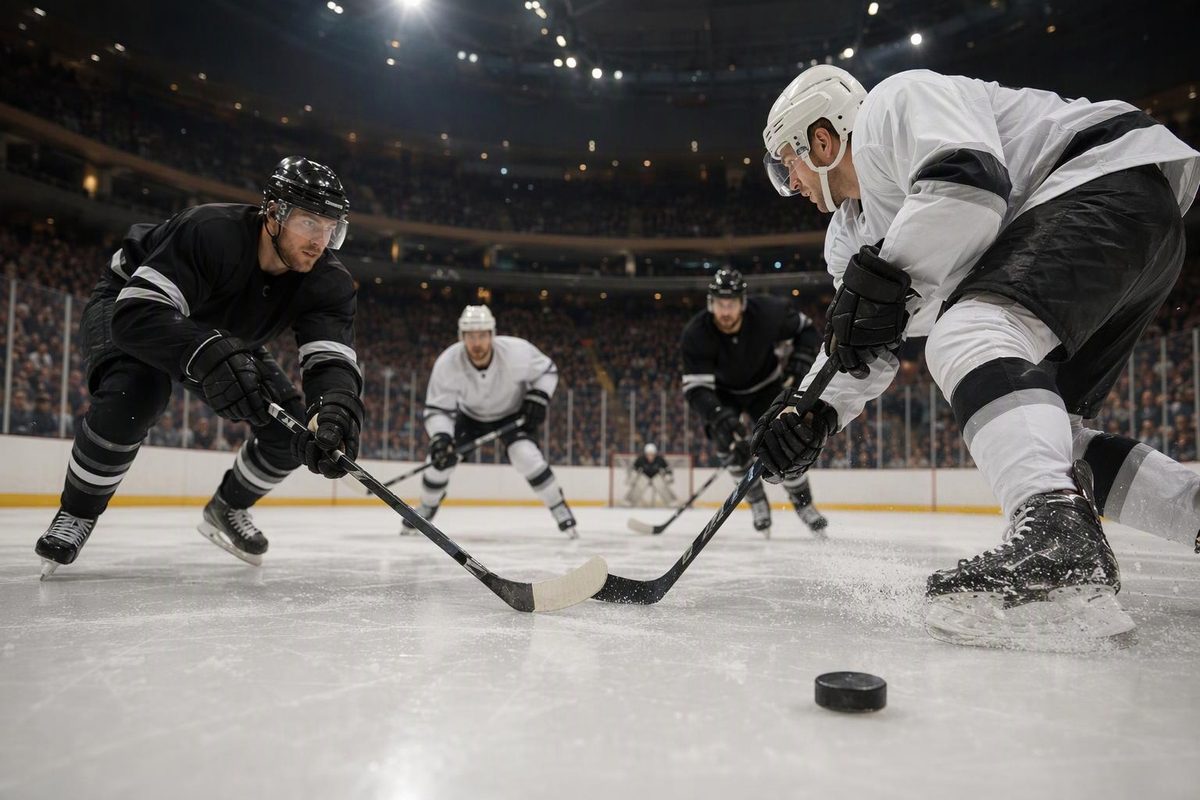
NHL regular-season games averaged 6.16 goals in 2025–26, counting both teams combined—or 3.08 goals per team per game. That calculation uses goals scored during regulation and overtime, excluding the extra goal awarded in the final score for a shootout win. The NHL’s 2025–26 team statistics total 8,086 goals across 1,312 games.
For a practical benchmark, think about six combined goals per NHL game, not six for each team. Here, 2025–26 is the completed-season reference; it is not a running average for 2026–27.
How the average is calculated
The formula is:
Combined goals per game = total goals scored ÷ total league games
Using the NHL’s full-season team summary:
- Total goals for across all 32 teams: 8,086
- Total team appearances: 32 × 82 = 2,624
- Actual games, with two teams in each: 2,624 ÷ 2 = 1,312
- Combined average: 8,086 ÷ 1,312 = 6.163, rounded to 6.16
- Per-team average: 8,086 ÷ 2,624 = 3.082, rounded to 3.08
These are calculations from the NHL’s team summary report. Add each team’s goals for once; adding league-wide goals for and goals against would count every goal twice.
The denominator matters too. Dividing by team appearances produces the per-team rate. Dividing by actual games produces the combined rate.
Recent NHL scoring averages
The last five completed regular seasons have stayed close to six combined goals per game.
| Regular season | Goals per team per game | Combined goals per game, approximately |
|---|---|---|
| 2021–22 | 3.11 | 6.22 |
| 2022–23 | 3.14 | 6.28 |
| 2023–24 | 3.08 | 6.16 |
| 2024–25 | 3.01 | 6.02 |
| 2025–26 | 3.08 | 6.16 |
Source: Hockey-Reference’s NHL league averages. Its goals column is per team, per game; the combined column above doubles those already-rounded figures, so it is approximate.
Recent scoring is higher than the roughly 5.14 combined goals per game in 2003–04, but below the roughly 8.02 in 1981–82, using the same league-average table. Six goals is a useful modern benchmark, not a constant across NHL history.
Why final-score averages can be higher
A shootout creates two different totals. If a game is tied 2–2 after overtime and ends 3–2 following a shootout, four goals were scored during playing time, but the final score adds up to five.
The NHL explicitly states that its standings credit the shootout winner with one extra goal for and the loser with one extra goal against. That awarded goal is included in standings totals. See the NHL’s scoring glossary.
For 2025–26, summing goals for in the final standings gives 8,205, compared with 8,086 in the team statistics report. Dividing the standings total by 1,312 games produces 6.25 combined goals per game. That measures final-score totals, including shootout awards—not just goals scored in regulation and overtime.
For more on the distinction, see whether shootout goals count as goals.
What the benchmark tells you
A league average describes the scoring environment, not a predicted score or an individual player’s scoring rate. In 2025–26, Colorado scored 3.63 goals per game, while Calgary scored 2.54, according to the same NHL team report.
When comparing a team with the league, use 3.08 per team, not 6.16 combined. When comparing seasons or datasets, keep the regular-season/playoff selection and shootout treatment consistent.